A simple method for checking in; a reading & a game for Disability Pride Month; plus some recent updates across the site.
Checking in with Comfort-Stretch-Panic
When something big is going on—when bad news arrives, as they say, on horseback—it can useful to check in. One of my favorite ways to do this can be accomplished in only a few minutes, either with a group or by yourself. Here it is.
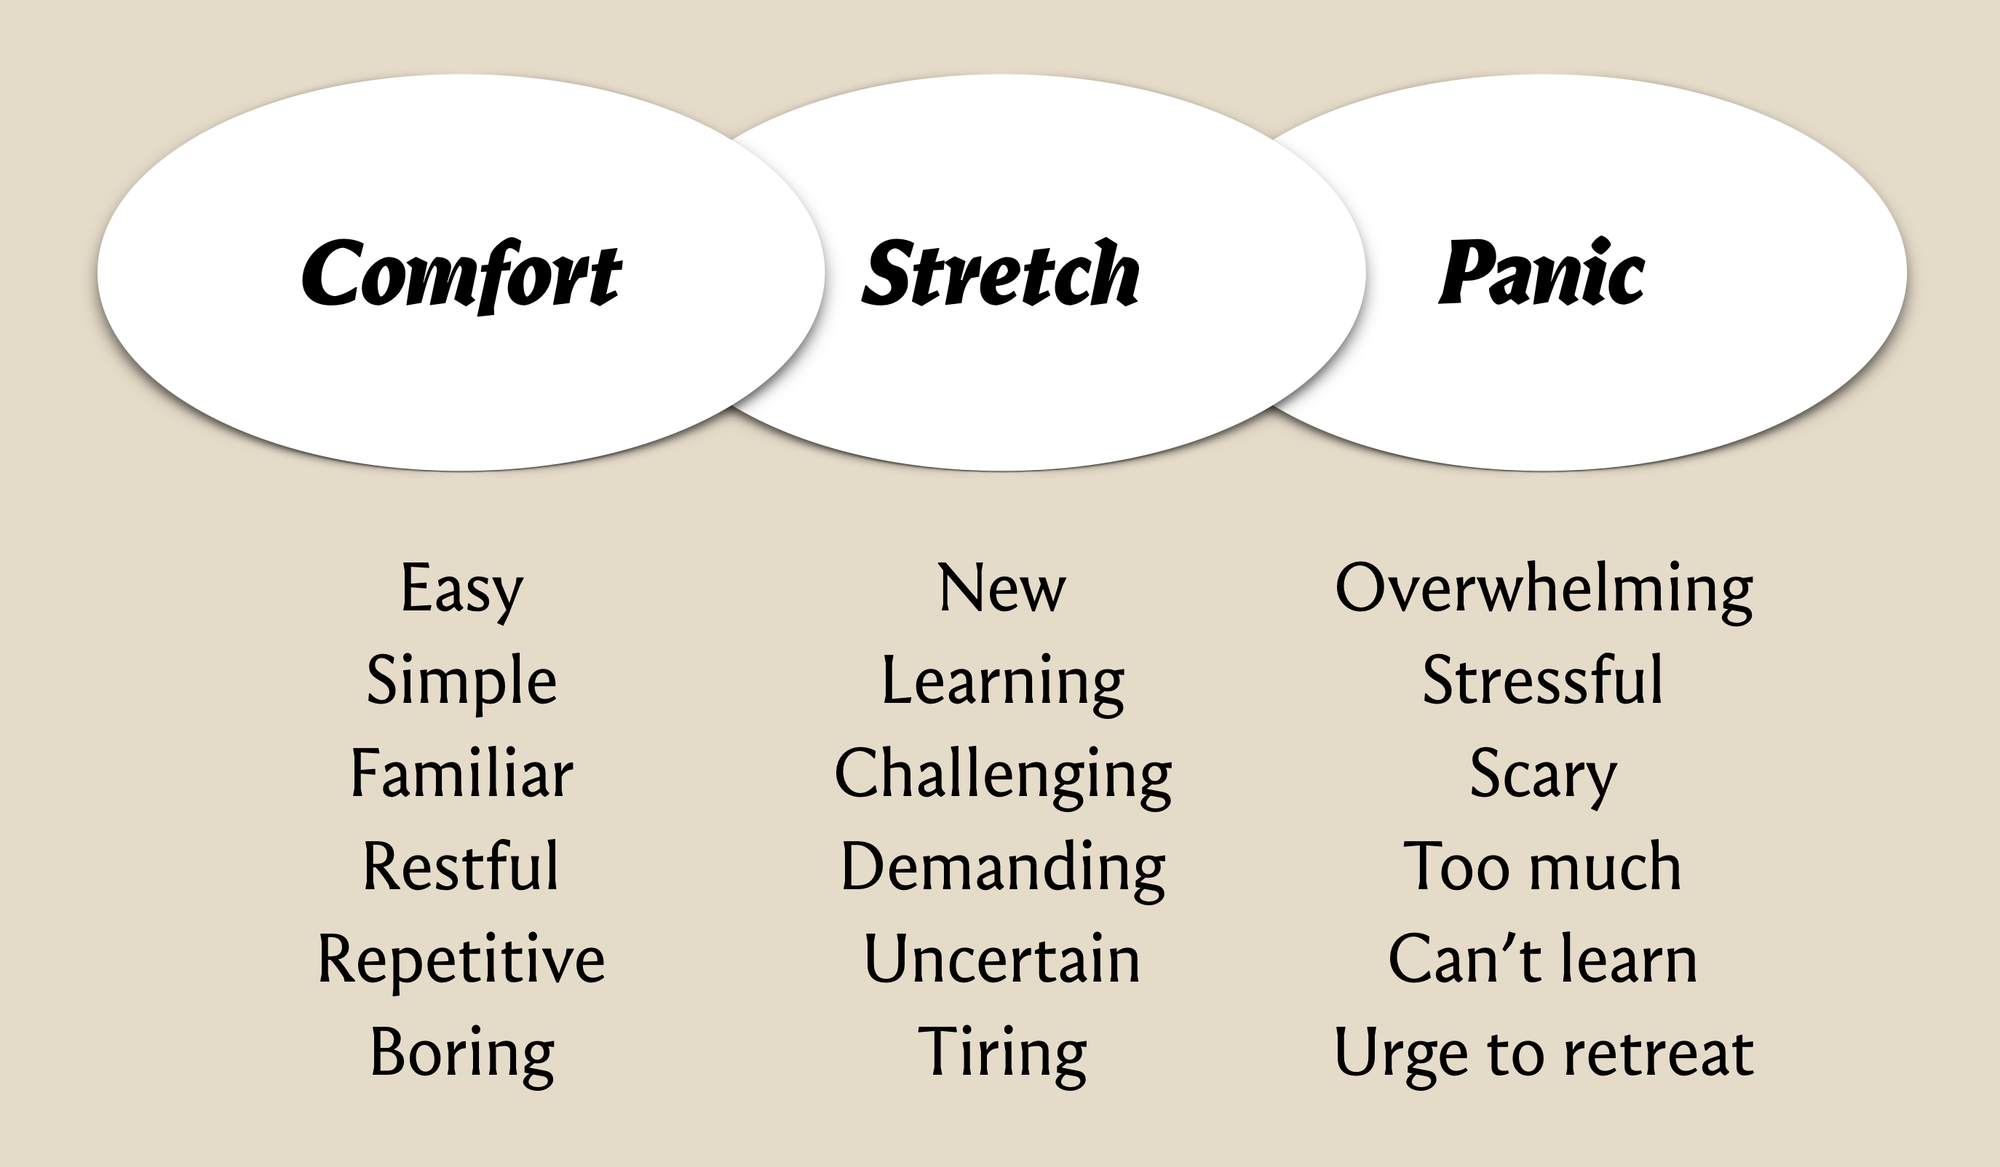
First, take a look at this diagram:
Then, consider the question:
Where are you right now?
Really, pause for a moment. Point to the screen. Find your spot. Then take a deep breath.
You might think Comfort is the ideal place, but in fact it’s not, at least for long. We can and should rest in comfort, but not abide there. The familiar becomes repetitive, then eventually monotonous and boring.
On the other end, Panic seems like a bad deal, and it is.
In general, a good spot to be is with one foot in Comfort and the other in Stretch. Shift back and forth as needed. In other words, Stretch, but when it’s too much, hopefully you can lean back into Comfort rather than tip forward into Panic.
The diagram is one expression of Tom Senninger’s ‘learning zone’ model. See additional notes on learning zones from a social learning perspective.
In any group of people, individuals will find themselves in different places on the diagram at different times. It’s more of a herd than a formation. This is OK.
When facilitating a meeting or other group session, you might practice guessing where individual people are on the diagram. That can influence whether you need to slow down, mix things up, take a break, or intervene in some other way. Better than guessing: ask. Run the check-in.
And when looking at the broader context of an organization or team, you can identify forces or vectors that push people toward one side or the other of the diagram. Contemporary Amazon-style management practice is to push people to the very cusp of Panic and then to keep up the pressure. On the one hand, people can produce a lot of work in that Stretch zone, which is a way to make numbers in the short term. But on the other hand, when the pressure stays on for too long people get tilted all the way into Panic. This is much worse in the long run, both in terms of (a) how people show up and (b) the damage it does to them personally as human beings over time.
Personally, I am emerging from a little period in the Panic zone, which I barely was aware of while in there. It’s like the feeling after a summer storm. A fresh, crisp breeze and air pressure ticking back up. Time to assess the damage and figure out what’s next.
First, I revisited this writing from 2023 and I invite you to as well. “They say the body is a city with nine gates. Two of mine happen to be a little finicky.”
And finally, I’ve updated my consulting page. I’ve wrapped up a series of projects and am putting together my next engagements. Do me a quick, valuable favor and take a look. Who do you know that I should be working with? Send ’em my way.
A reading of a short poem by W.S. Merwin: The Estuary. I share a few words about what might have influenced Merwin at the time of the poem’s composition.
You know I love simple practices. This is one of the simplest, coursing down the centuries since, at least, these discourses in the Pāli Canon where the Buddha is in conversation with a guy called Saṅgārava. Now Saṅgārava seems to have been a stand-in or container for various questions and metaphors about water.
You might be thinking of that cliche about ‘mind like water’. Sure, but let’s ask: what kind of water, and in what way? Water as it changes in time and place and circumstance is an example of something that is always becoming otherwise. It has this in common with you, and me, and everything around us, and in us.
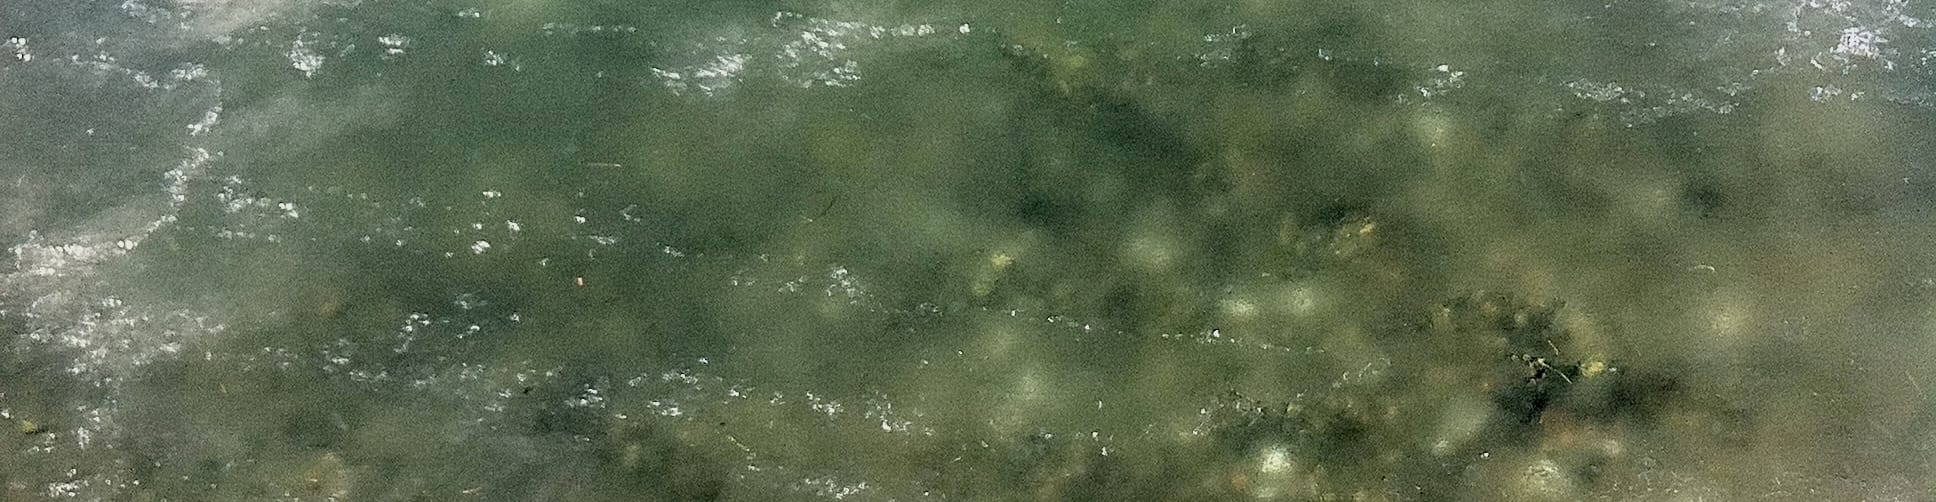
So the practice, as I’ve learned it from two different teachers at two different times, is this. Take a moment and notice your own awareness. What kind of water is this like? Perhaps still, or flowing, or murky, or raging, or a turbid estuary, a snowflake or an ice sheet, or overgrown with algae, or a trickle in a dried-up stream.
As you do this, there is no need to adjust, to evaluate, to search for reasons or explanations or blame. It is a practice of noticing, and noticing only—a chance to recall or identify one sensation that is most similar to another. Some qualities are more pleasant or useful than others. And whatever it is now, it will soon be otherwise.
Over the past two weeks I’ve been celebrating the first (?) decade of Improve Something Today by putting together 10 posts. I wanted to share them with you as a bit of a wrap-up, and express again my gratitude for your being a part of this, for reading what I have going on, and for replying or getting in touch with your thoughts in various ways.
So: thanks again. And here are 10 things to read, if you like. Have a great time—I know I did!
I started the series with 10 things I’ve learned during this writing:
Part of looking back over the decade I’ve been working on Improve Something Today involved thinking about books. A lot of what I’ve written here is about books (e.g.). But here are nine books I feel like I’m always reading even after I put them down: three about work, three about the world, and three about Buddhism. They’re books I love! For each I offer a small invitation or comment. Take these as hints as to why these books in particular have made themselves comfortable in my brain.
📖
Links go to bookshop.org. Here you can order books, support local booksellers of your choosing, and allow some pennies to fall off as a commission for me. I keep a little storefront with all these books and more.
Three books about work
Theory of the Gimmick: Aesthetic Judgment and Capitalist Form, by Sianne Ngai (2022)
Ngai opens her book with this set of questions:
What are those of us living in capitalist societies saying when we call something a gimmick, regardless of the varying objects to which the evaluation is applied and varying identities of those applying it? What is being accurately registered about our world, and also our sociality or way of sharing this world, in this ambivalent, if mostly negative aesthetic judgment? And without the speakers necessarily or explicitly knowing it? We can work our way in with a more indirect question: Why are gimmicks often comically irritating?
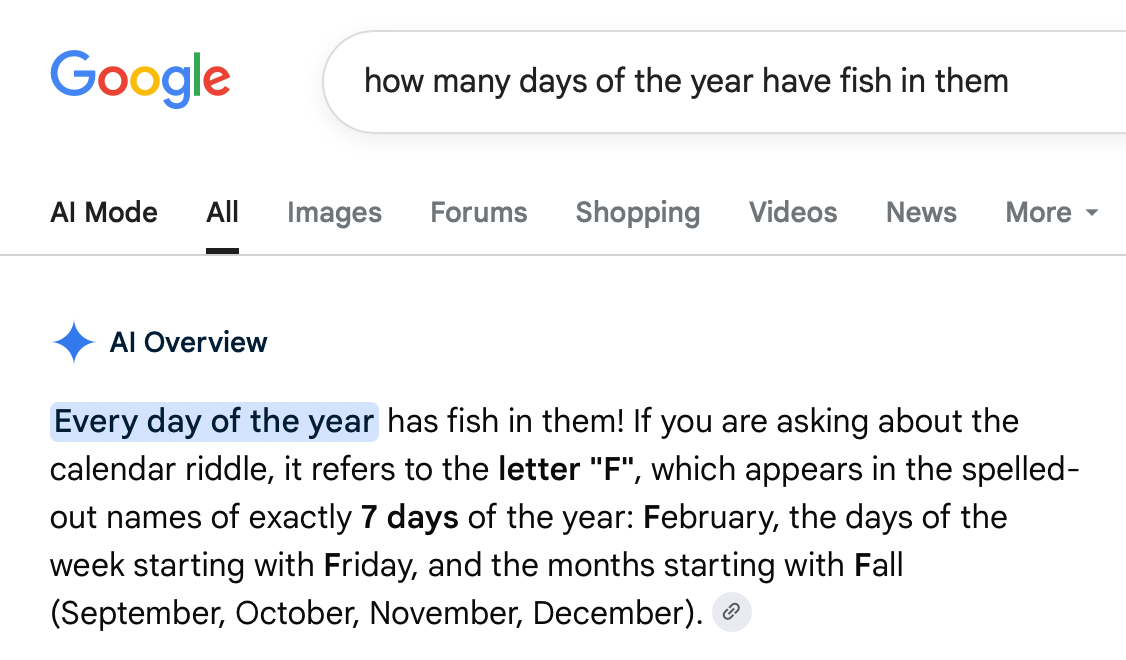
We’re in a ‘comically irritating’ moment, here at the tail end, hopefully, of the interval where capital wants to inject LLMs into everything in ways that are ugly, ineffective, and gimmicky. There are so many reasons to be skeptical of this whole project, but the surface-level, knee-jerk reaction to the call-and-response chatbot as gimmicky is a good enough stopping point for me. Last week I had as much fun as everyone else kicking the tires on Google after it turned its search bar into whatever this is:
Brian’s Google experience from May 30, 2026.
It is this objection to asinine gimmickry that anybody peddling LLM integrations would need to overcome in order to get people to engage with the things. So far, the track record has not been great. I’m grateful to Ngai’s book for giving me some ways to think about this, since it has become a great concern of our moment.
Addiction By Design: Machine Gambling in Las Vegas, by Natasha Dow Schüll (2012/2025)
This 2012 book is based on the years of fieldwork that Schüll, a cultural anthropologist, did in and around Vegas. She noticed the integration of software design and user experience into the business of casino gambling in order to make devices and spaces into ‘machine zones’ which keep customers dialed in to a carefully designed plateau of unhappiness. The machines benefited from now-commonplace technological innovations like mobile payments and touchscreen UIs, evaluated using familiar-sounding measures like ‘time on device.’ Beyond Las Vegas, this book also stands as a remarkable prefiguration of what the dissolving of software design and user experience into capital has done to the rest of—by the time of this writing—the entire goddamn world. One outcome of reading this book might be to radicalize someone against gambling, if they weren’t already there. The effect it had on me was to radicalize me against corporate social media, because I noticed how these companies set their phalanxes of PhDs to similar projects of designing the various blue/bad websites and apps into these deeply harmful, riotously lucrative ‘machine zones.’
The Real World of Technology, by Ursula Franklin (1990/1999)
Such an incredible collection of talks. The passage people who’ve worked with me have likely seen is this, or something based on it:
Should one not ask of any public project or loan whether it: (1) promotes justice; (2) restores reciprocity; (3) confers divisible or indivisible benefits; (4) favours people over machines; (5) whether its strategy maximizes gain or minimizes disaster; (6) whether conservation is favoured over waste; and (7), whether the reversible is favoured over the irreversible? The last item is obviously important. Considering that most projects do not work out as planned, it would be helpful if they proceeded in a way that allowed revision and learning, that is, in small reversible steps.
The idea of ‘small, reversible steps’ originates here, with Franklin. And this short paragraph gives a framework for a multi-objective consideration that is totally possible and far beyond what organizations are doing decades later. The whole book is like this.
Three books about the world
Necropolitics, by Achille Mbembe (2019)
Put simply, this is a way of looking at political power in terms of who lives and who dies—going far beyond the ‘biopower’ sense of the state’s right to control the lives of people to a ‘necropolitical’ sense of permanent, deliberate positioning of people between life and death. Although there’s a lot more to it than that. This book has helped me discern the connections between many specific horrors of our christian fascist era here in America, from the failures of COVID to ongoing support for genocides to the denial of access to healthcare.
The Art of Loading Brush: New Agrarian Writings, by Wendell Berry (2019)
A passage:
Provision, I think, is never more than caring properly for the good that you have, including your own life. As it relates to the future, provision does only what our oldest, longest experience tells us to do. We must continuously attend to our need for food, clothing, and shelter. We must care for the land, care for the forest, plant trees, plant gardens and crops, see that the brood animals are bred, keep the house and the household intact. We must teach the children. But provision does not foresee, predict, project, or theorize the future. Provision instructs us to renew the roof of our house, not to shelter us when we are old—we may die or the world may end before we are old—but so we may live under a sound roof now. Provision merely accepts the chances we must take with the weather, mortality, fallibility. Perhaps the wisest of the old sayings is “Don’t count your chickens before they hatch.” Provision accepts, next, the importance of diversity. Perhaps the next-wisest old saying is “Don’t put all your eggs in one basket.” When the bad, worse, or worst possibility presents itself, provision only continues to take best possible care of what we have, or of what we have left.
Laozi’s Dao De Jing: A New Interpretation for a Transformative Time, by Ken Liu (2025)
I love that this is called an interpretation because, in addition to his own translation, interposed throughout the text Liu offers historical commentaries, his own commentary, and little bits of context and memoir. The effect is to get a reader to slow the hell down a bit and engage with the text. The Dao De Jing is compact and unadorned, which means it’s easy to whirl through it and slot oneself in the category of having read it. This interpretation gives the opportunity to slow down a bit, to linger, to think.
Three books about Buddhism
A Guide to the Bodhisattva Way of Life, by Śantideva, translated by Wallace & Wallace (1997)
It’s true that Śantideva lit a fire under me:
Upon finding the boat of human birth now, cross the great river of suffering. O fool, there is no time for sleep, for this boat is hard to catch again.
My guy knew a few things. First, he knew that “just as lightning illuminates the darkness of a cloudy night for an instant ... occasionally people’s minds are momentarily inclined toward merit.” And second, he knew the spirit of awakening—what it means to aspire for it, and means for venturing towards it. My meanderings have involved study and reading and practicing in various contexts and communities; all along the way Śantideva is there for me to return to. His energy and inspiration crackles across the centuries. I see him as the Victor Frankenstein of awakening, laboring away at the expense of sleep and sunlight until something astonishing arises.
Seeing That Frees: Meditations on Emptiness and Dependent Arising, by Rob Burbea (2014/2025)
This is a fairly dry primer on, manual about, consideration of emptiness. I never met Burbea. He passed away a few years ago, but a friend of mine studied with him and she says he was the real deal. On the basis of this book, I believe it. Emptiness (suññatā) is one of those concepts that takes some effort to make friends with, and Burbea’s work here has been really beneficial for me in this regard. The companion website for this book is a good starting point.
The Other Shore: A New Translation of the Heart Sutra with Commentaries, by Thich Nhat Hanh (2017)
People sometimes ask me what book they should read about Buddhism. In one regard, this like asking someone what book they should read about bicycling. It’d probably be better to just get on a damn bike, ideally with friends, and figure out how to go. That being said, people write books about all kinds of things, and this small book is a beautifully written discussion of the Heart Sutra alongside Nhat Hanh’s last translation of the same (it’s a text he fiddled with over the course of a long life).